It’s been a while since writing a market snapshot update but here we are with August as the first month to analyze. I’ll note, that looking at data of only one month doesn’t always paint the best picture of the market overall, as a larger sample size, such as quarterly, is a much better indicator. Nevertheless there is information to be shared, supported by the data.
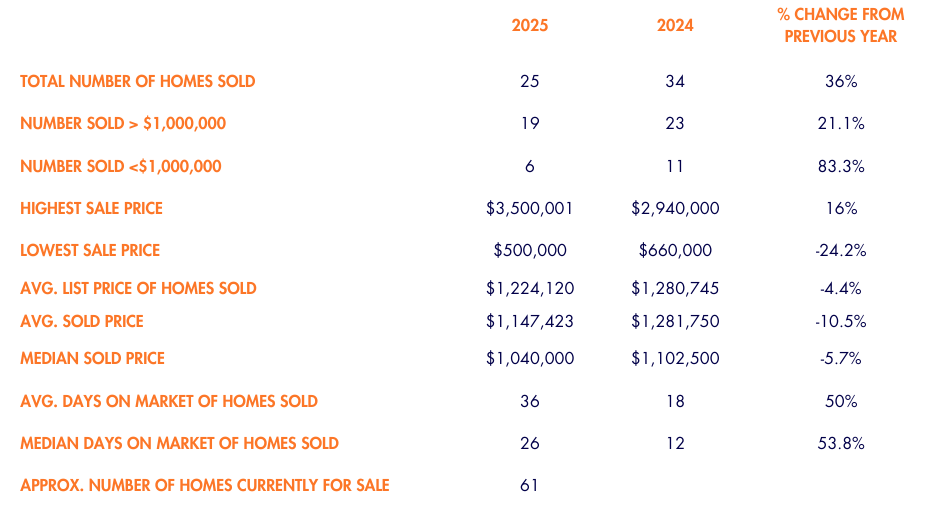
Beginning in the Spring of 2025, the market experienced a noticeable pull-back. The market slowed, sales were noticeably slower, and the number of offers on any given property noticeably less. For the first time in over a decade, we were negotiating mono y mono with a single buyer on several sales, and down from the listing price. The market has since picked up a bit, but it is still a slower market compared to last year or any year prior. This is what many are saying is the “new normal” which very closely resembles how the real estate market was in the early 2010’s. You can see that this time last year, at least from this data set, that homes were still on average selling for at or above their list price, whereas this year homes on average sold for about 6% less than their list price. You’ll also see the days on market jumped up over 50% compared to last year.
Even still, the market is still strong in Claremont. Homes are still mostly selling in less than 30 days and prices are holding relatively well. The 6% differential does not represent a 6% drop in values, as it is largely due to many homes being over-priced to start with.